SportsDataTutorials

Sports analytics, the hands-on way

Learn sports analytics by actually doing it.

Pull real MLB, NBA, soccer, NFL and NHL data, analyse it in Python, and build charts you made yourself - one focused tutorial at a time.

Start here Browse the 11 courses

Newest: Gaussian Mixtures: EM Finds the Court's Zones, part 11 of Machine Learning from Scratch, 11 October 2026.

The courses

11 courses · 100 tutorials · about 13 hours

Every tutorial belongs to exactly one course, in a deliberate order. Each course page carries a syllabus, a one-ZIP bundle of all its code and data, and progress you can tick off as you go.

Foundations and method

  1. Python Foundations for Sports Data

    Zero to competent: install Python, learn pandas on real standings, and finish by building a league table from raw results.

    Beginner

    10 parts ~66 min total

  2. Sports Data Visualization

    Ten chart types, each built on real sports data, ending with the styling pass that makes a figure publishable.

    Beginner to Intermediate

    10 parts ~60 min total

  3. Statistics for Sports Data

    The measurement toolkit: distributions, z-scores, percentiles, outliers, time series, Simpson's paradox — closing with what actually predicts winning.

    Intermediate

    13 parts ~88 min total

  4. Randomness, Inference & Simulation

    Monte Carlo seasons, bootstrap intervals, permutation tests, power, chi-square, Bayesian updating, regression to the mean — how to tell signal from luck.

    Intermediate

    11 parts ~109 min total

  5. Machine Learning from Scratch

    Eleven models and methods — gradient descent to Gaussian mixtures — every one implemented in pure numpy on real NBA data.

    Advanced

    11 parts ~109 min total

  6. Working with Real Sports APIs

    Read API docs like a developer, then pull your first real data from MLB, the NBA, StatsBomb, nflverse, the NHL and ESPN.

    Beginner

    7 parts ~65 min total

By sport

  1. Baseball Analytics with Statcast

    Exit velocity, pitch maps, spray charts, luck-hunting and Pythagorean wins — the richest free data in sports, put to work.

    Intermediate

    7 parts ~49 min total

  2. Basketball Analytics with the NBA API

    Ratings tables, shot charts, zone efficiency, the three-point revolution, rest and back-to-backs — and an Elo system you build yourself.

    Intermediate

    9 parts ~69 min total

  3. Soccer Analytics with StatsBomb & xG

    Pass maps, shot maps, heatmaps and pass networks from free pro event data — then a complete World Cup: scoring by stage and a Poisson scoreline model.

    Intermediate

    8 parts ~66 min total

  4. NFL Analytics with nflverse

    EPA built by hand, quarterback efficiency, play-calling tendencies, receiver value, the fourth-down decision, spreads as probabilities and coaching tenure.

    Intermediate

    9 parts ~105 min total

  5. Hockey & Cross-League Projects

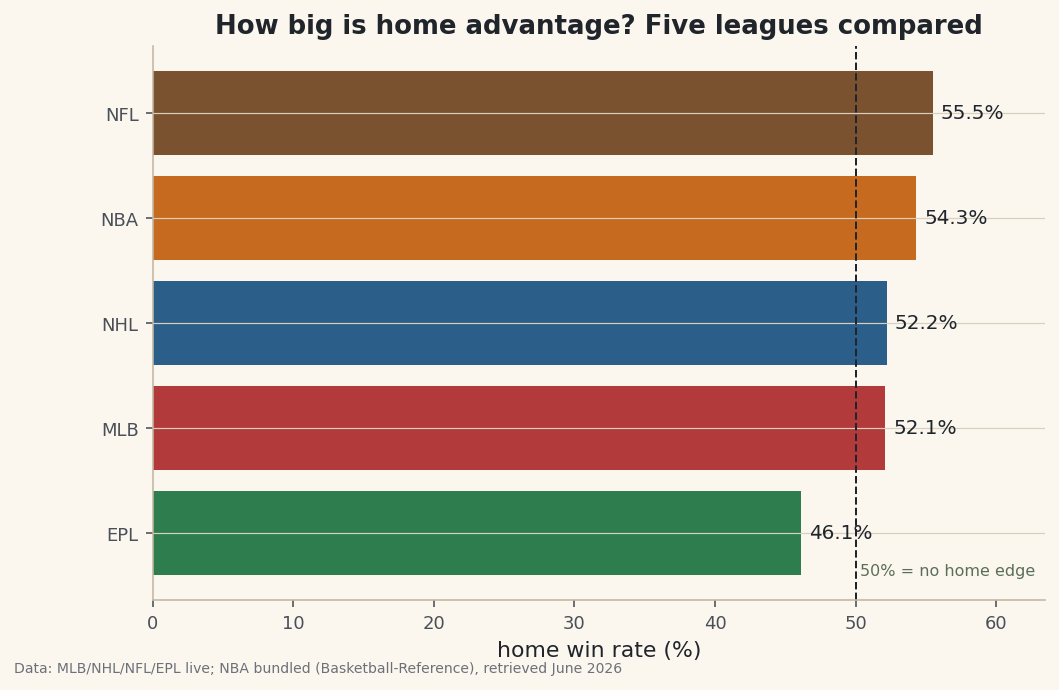
    Four NHL builds — shots, leaders, form, and the PDO luck flag — then the capstone: measuring home advantage across five leagues at once.

    Intermediate

    5 parts ~43 min total

All 11 courses

Latest tutorials

See the learning path

  1. Gaussian Mixtures: EM Finds the Court's Zones

    EM by hand on 24,947 NBA shot locations: six Gaussians find the court's zones, and 704 shots logged at the rim break the likelihood.

    Machine Learning from Scratch, part 11 of 11
    BasketballAdvanced~31 min

  2. Principal Component Analysis: Where a Box Score Hides Its Shooting

    PCA by hand on 279 NBA players: volume and inside-outside carry 63% of ten box-score rates, and the shooting signal hides in the smallest component.

    Machine Learning from Scratch, part 10 of 11
    BasketballAdvanced~28 min

  3. Regression Discontinuity: What a Close Win Is Worth

    Regression discontinuity by hand on 13,904 NFL team-games: a close win buys nothing next week, and the balance check shows close games are not coin flips.

    Randomness, Inference & Simulation, part 10 of 11
    FootballAdvanced~23 min

  4. Bradley-Terry Ratings: Strength From Who You Beat

    Fit Bradley-Terry ratings by hand with the MM algorithm: schedule-adjusted strength for every NFL team, and an honest out-of-sample test against win %.

    NFL Analytics with nflverse, part 9 of 9
    FootballIntermediate~11 min

  5. Rank Correlation: How Much of an NFL Season Carries Over

    Kendall's tau and Spearman's rho by hand on 26 NFL season pairs: order persists at a median tau-b of 0.205, and vanishes inside the playoff field.

    Statistics for Sports Data, part 13 of 13
    FootballIntermediate~18 min

  6. Quantile Regression: The Whole Margin, Not Just the Average

    Fit five quantile lines to 7,276 NFL margins with no scipy: the spread shifts the whole distribution, and the 80% band stays 34 points wide.

    NFL Analytics with nflverse, part 8 of 9
    FootballAdvanced~19 min

Capstone project

Same Question, Five Sports: Quantifying Home Advantage Across Leagues

A capstone: ask one question - how big is home advantage? - across five leagues, reusing everything you've learned, and put the answers on a single comparison chart.
Read the capstone

One chart comparing home-win rate across MLB, NBA, soccer, the NFL, and the NHL.

Pick a sport

  • Foundations

    23 tutorials

    Sport-agnostic skills - Python, pandas, plotting and data cleaning - that every other tutorial builds on.

  • Baseball

    15 tutorials

    MLB Statcast is the richest free data in sports. Pull it with pybaseball and build leaderboards, heatmaps and more.

  • Basketball

    35 tutorials

    The NBA's stats API is powerful but picky. Learn to pull it politely, then build standings, ratings and shot charts.

  • Soccer

    10 tutorials

    Free event data from StatsBomb plus xG from Understat let you analyse matches like a pro - no paid feed required.

  • Football

    12 tutorials

    nflverse opens up every NFL play. Compute EPA, compare quarterbacks, and learn the modern football-analytics toolkit.

  • Hockey

    5 tutorials

    The NHL's public API needs no key. Pull standings and play-by-play, then plot shots on a rink you draw yourself.

How this site is different

The full methodology

Every output is real

The build system only publishes a chart or a printed result if the tutorial's script actually produced it when it was run. Nothing is mocked up, and no number is typed in from memory - every printed block on the page is captured stdout from that finished script, which you can download and run yourself.

The code runs in your browser

On most tutorials the Python blocks carry a Run button, powered by Pyodide, with the bundled real datasets pre-loaded - edit the code, break it, re-run it, nothing to install. Where code needs live APIs or specialist libraries the browser can't load, the page says so and hands you the finished script to run locally instead.

One curriculum, not a pile of posts

Every tutorial after the first declares its prerequisites and builds on the ones before it: foundations first, then the sport track you care about, then statistics and machine learning implemented from scratch. The learning path shows the whole spine.

Free data, named sources

Statcast, StatsBomb Open Data, nflverse, and the NBA and NHL public APIs. Every figure captions where its numbers came from - and, where they came from outside, when they were retrieved - and every finished script is downloadable - with the bundled sample data where the tutorial has one, and the live-API tutorials pull their own.